Using Venn Diagrams Problems Worksheets
Students have long used Venn diagrams in English and Social Studies classes by the time we encourage them to use it math. Students sometimes will do a double take when they first see them being used in math class. Venn diagrams are great to evaluate the relationships. Especially when it comes to data. We can use them to visualize our data and see if there is something that separates it or connects it. These tools are primarily used in statistics, probability, and situations where we are evaluating the logic of something. Students learn how to create, read, and interpret Venn Diagrams imaging of logic statements with this collection of worksheets and lessons.
Aligned Standard: High School Data Modeling
- Getting to Work Step-by-Step Lesson- How do all the employees get to work? There are even some that do it multiple ways.
- Guided Lesson - Examine a voters poll, the participation at an annual school dance, and what employees drink at the office.
- Guided Lesson Explanation - I feel that it is fair to disclose that number two is very difficult for most students.
- Practice Worksheet - I give you ten scenarios that I would like to know a singular part of, but they require Venn diagrams.
- Practice Worksheet 2 - I not only double up on the practice in this area, but I also give you a fitting picnic clip art.
- Matching Worksheet - Find the answers to all the complex questions I throw at you.
- Using Venn Diagrams Five Pack of Worksheets - I really tried to find situations where Venns applied. I actual did a few hours of research to see where this skill is used in the real world.
- Answer Keys - These are for all the unlocked materials above.
Homework Sheets
Diagramming these helps out a great deal.
- Homework 1 - In an office of 40 employees, 17 travel by car, 23 travel by bike, and 10 take both cars and bikes.
- Homework 2 - How many employees in the office are not enrolled in either Car or Bike?
- Homework 3 - Now we want to find the number of students interested in participating in the different events. Let's diagram what we were told.
Practice Worksheets
I left a template of Venn diagrams for you to work with.
- Practice 1 - There are 35 people working in a bakery. 15 people are making cakes, 20 people are making chocolate cookies, and 8 people are making both cakes and cookies. How many people in the shop are not making cakes or cookies?
- Practice 2 - 18 students are in a college class. 10 students have Samsung cell phones. 8 students have Nokia cell phones. 5 students have both a Samsung and Nokia cell phone. How many students have only a Nokia cell phone?
- Practice 3 - 10 of the students in Johnson's class like to eat oranges. 7 students like to eat cherries, and 4 students like to eat both oranges and cherries. How many students like to eat cherries, but not oranges?
Math Skill Quizzes
We don't ask you to create Venn diagrams. Instead you are asked to apply them.
- Quiz 1 - Kenny takes a poll on favorite things to eat. 8 people like to eat candy. 10 people like to eat cookies. 7 people like to eat both candy and cookies. How many people did he poll?
- Quiz 2 - Sybil takes a poll of people's favorite dangerous animal. 7 like polar bears and 3 like sharks. 2 people like both polar bears and sharks. How many people like polar bears only?
- Quiz 3 - 10 of the students in Lea's class can swim the backstroke and 7 can swim the breaststroke. 4 students can swim both the strokes. How many students can swim the breaststroke, but not the backstroke?
How to Use Venn Diagrams for Math Problems
This is a schematic way of representing the elements of a group or set. In Venn diagrams, you get a number of elements or a bunch of numbers, and then all you have to do is use that information to construct a Venn diagram and then figure out the rest of the information.
They can help you understand the relationships that do and do not exist between these elements. Venn diagrams help you represent a diagram in a pictorial form. It represents the intersection and overlapping of two groups in an understandable manner. This allows you to quickly and easily compare and contrast these elements.
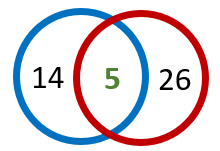
To understand how Venn diagrams help, consider the following example: There are a total of 40 students, out of which 14 are taking English Composition, and 26 are taking Chemistry. If there are 5 students taking English and Chemistry in both classes, how many students are in neither class? And how many of them are in either class?
To solve these, lets walk through how we would approach preparing a Venn diagram for this situation. Draw two circles, one representing English (blue in our diagram) and the other representing Chemistry (red in our diagram) with a part of circles overlapping into each other. Now write the respective numbers into the parts of the circle and use the information to solve the word problem you have at hand. 14 would be placed in the blue circle, 6 in the red circle, and 5 where the overlap is. To answer these questions we need to realize that those 5 students are accounted for already in each of those classes. So that would mean that there a total of 5 less enrolled in each class. Seeing that through the Venn diagram allows us to come to that conclusion a little easier.
